THE American bulls are charging ahead in 2016, making Wall Street the top performing market among the developed nations.
The Dow Jones Industrial Average breached the 19,000 level for the first time, hitting a record high of 19,756.85 points. However, the long-anticipated rate hike by the Federal Reserve last week, of 25 bps, gave the rally a slight break.
Nonetheless, the five-year bull run in US equities that began after the sub-prime loan crisis in 2008 is not showing any signs of slowing. However, the Asian bulls do not seem to be as strong, with the economic slowdown becoming more pronounced in the region, once the sweetspot of growth.
In contrast to the consensus view, the news that Donald Trump had won the presidential election did not dampen the sentiment.
Since Trump’s victory on Nov 8, the S&P 500 index has risen 6.01% to a record high of 2,259.53 points while the Dow Jones Industrial Index gained 8.2% to 19,756.85 points (as at Dec 9). Year to date, the two benchmark indices are up 10.55% and 13.38% respectively.
The so-called “Trump Bump” has been fuelled by expectations of tax cuts that will drive a rebound in US corporate profits. Hence, US corporates with a strong domestic focus were among the biggest gainers.
The strength in US equities was also fuelled by a flood of capital returning to the so-called “safe haven” dollar-denominated assets following the presidential election. In the aftermath of the US polls, the US dollar index, which is weighted against a basket of major currencies, has gained 3.55%.
On the other side of the equation, however, emerging market equities have been sold down as global fund managers pared down positions in the riskier markets. Trump’s election rhetoric on protectionism is not helping emerging markets either.
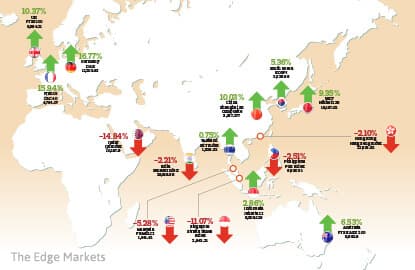
Take Chinese equities, for example. The Shanghai Stock Exchange Composite Index fell 8.65% during the year to close at 3,232.884 points. This ranks the Shanghai composite as 12th worst performer among the major indices this year.
In US dollar terms, Chinese equities performed even worse, dipping 14.28% in the same period. Concerns of additional curbs on the property market, however, offered some recovery for Chinese equities. China’s central bank has already clamped down on mortgage lending, particularly in areas deemed to be overheated.
As a result, some investment money has flowed back into equities. Still, the Chinese indices grossly underperformed despite the rebound that started in the second half of the year.
However, Hong Kong’s Hang Seng Index gained a marginal 3.86% in the same period.
In Asia Pacific, the Shanghai Composite was the third worst performing, only behind Laos Securities Exchange Composite Index, which lost 13.6%, and Mongolia Stock Exchange Top 20, which lost 14.54% in the same period.
The FBMKLCI may have only lost 3.02% this year, but it still ranks as the fifth worst performing major equity index in Asia Pacific. In dollar terms, the KLCI is down 5.47%.
Compared to some of the country’s neighbours, Malaysian equities performed rather poorly.
Thailand’s SET shot up by 18.5% this year to take the top spot as the best performing Asian index, closing at 1,526.32 points. Coming in a close second was Indonesia’s Jakarta Stock Exchange Composite Index, which gained 15.57% to close at 5,308.126 points.
Even the Philippines Stock Exchange Index ended the year marginally higher by 1.31% at 7,043.16 points.
In fact, most emerging market Asian equities did not perform that badly, at least, not on a global level. Only Laos and Mongolia ranked among the 10 worst performers.
The bottom-10 are dominated by African countries that are grappling with weak economic growth stemming from low commodity prices, particularly oil.
Zimbabwe’s Lusaka Stock Exchange All Share Index took the bottom spot this year, losing 26.79% in value as at Dec 9. The Ghana Stock Exchange Composite Index, meanwhile, lost 21.21% in the same period.
Interestingly, three of the world’s top 10 worst performing equity indices this year were those in Denmark, Italy and Portugal.
Denmark was the third worst performer with the OMX Copenhagen 20 Index losing 15.43% this year. Italy’s FTSE MIB Index lost 14.59%, while Portugal’s PSI 20 Index lost 12.7%.
On that note, it is interesting to note that London’s FTSE 100 index has gained 11.4% at 6,954.21 points as at Dec 9. UK equities have effectively reversed losses from the initial post-Brexit selldown.
The market may be cautious about Brexit’s implications, but the process of leaving the EU will be a long arduous journey that will take at least two years.
In US dollar terms, however, the UK’s bellwether index has lost 4.73% in value this year.
The strong greenback, however, has worked to the advantage of Japanese equities. The Nikkei 225 index spent most of the year in the red on concerns that the economic stimulus measures have not been effective.
But following the rally in the US dollar after Trump’s win, the Nikkei 225 shot up by 16.89% to end the year above the 19,000 point level. Overall, the Nikkei 225 is marginally lower by 0.2% as at Dec 9. After strengthening for most of the year, the Japanese yen depreciated by 11.98 against the US dollar following Trump’s election.
Real winners
It is interesting to see that some of the top performing equity indices (at face value) this year are also the worst. Take Venezuela’s Caracas Stock Exchange Stock Market Index (IBVC), for example, which saw a 149% gain this year to close at 14,588.25 points on Dec 9.
However, this is largely due to the hyperinflation-led depreciation of the Venezuelan bolivar that is estimated to have lost over 75% of its value this year on the black market.
Officially, it costs 10 bolivars to buy one US dollar, but in the black market, it costs around 3,500 bolivars. The rate could climb as high as 4,000 bolivars per US dollar by the end of the year, compared with 900 bolivars at the beginning of the year.
For a perspective on how bad the situation is, President Nicolas Maduro has moved to remove from circulation the country’s largest denomination note of 100 bolivars, now worth less than three US cents. Based on the official exchange rate, however, the IBVC has gained 57% this year in US dollar terms.
In second place behind Venezuela is the Egyptian EGX 30 Price Return index, which gained 61.26% this year. The EGX 30’s strong performance can be traced to the government’s decision to scrap controls on the Egyptian pound.
It has allowed the Egyptian pound to fall by 57.09% against the dollar this year, but it has also removed the devaluation risk that has kept foreign investors away. Following the Egyptian pound’s float in November, it is estimated that EGP2.8 billion worth of overseas funds flowed in.
In US dollar terms, however, the EGX 30 has still lost nearly 31% of its value this year, the third worst performing equity index in dollar terms.
The overall best performing equity index in 2016 has been Brazil’s Ibovespa Index, which has gained 39.6% as at Dec 9. With the Brazilian real appreciating 15.7% against the US dollar this year, the Ibovespa Index has gained 63.85% in US dollar terms.
Close behind in second place is Kazakhstan’s KASE Stock Exchange Index, which gained 60.47% this year. Include the Kazakhstani tenge’s 1.86% gain against the dollar, and the index’s value rose by 63.31% this year.
The BVL Peru General Index came in third with a 58.53% gain. The Peruvian sol ended the year almost unchanged against the dollar.
Save by subscribing to us for your print and/or digital copy.
P/S: The Edge is also available on Apple's AppStore and Androids' Google Play.