
This article first appeared in Personal Wealth, The Edge Malaysia Weekly on June 26, 2017 - July 2, 2017
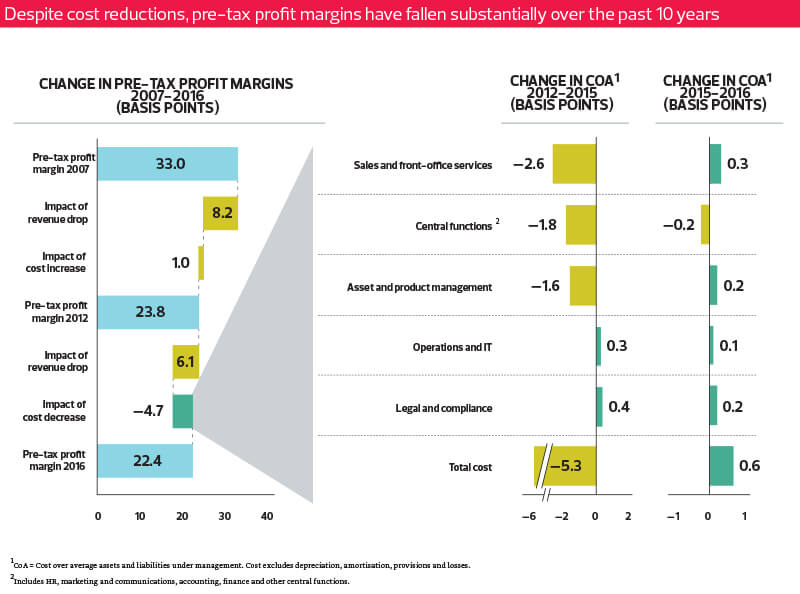
Wealth management firms, both independent and bank-backed ones, have seen their pre-tax profit margins decline in each region of the world in the past decade. This has been due to factors such as the push by regulators for greater transparency and investor protection, the rise of low-cost passive investment vehicles such as exchange-traded funds (ETFs) and increasing competition from financial technology (fintech) firms, according to Boston Consulting Group’s Global Wealth Report 2017.
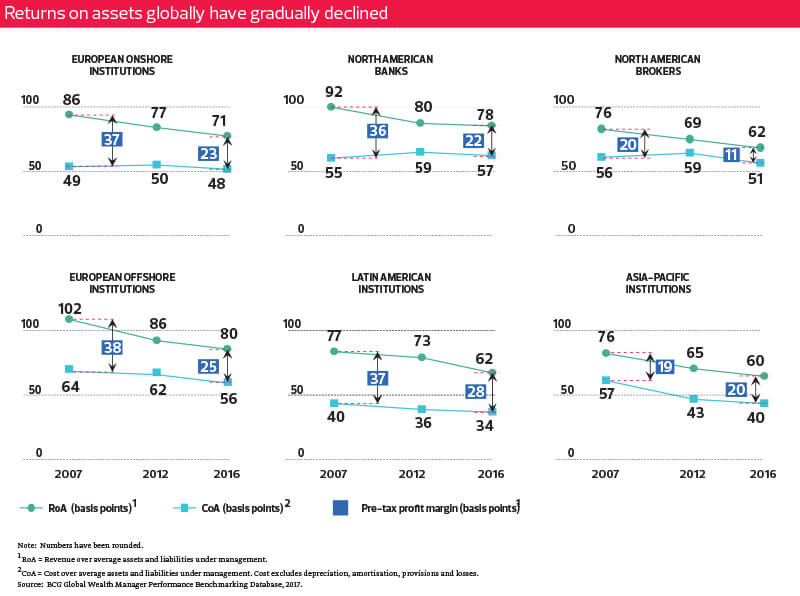
The report says the biggest declines in pre-tax profit margins (also termed as return on assets in the report) occurred in European onshore and offshore institutions and North American banks. European onshore and offshore financial institutions saw pre-tax profit margins fall to 0.23% and 0.25% respectively last year from 0.37% and 0.38% in 2007. The margins of North American banks fell to 0.22% from 0.36% during the period.
Asia-Pacific institutions are the only bright spot among the regions. Their pre-tax profit margins increased slightly to 0.2% from 0.19% in 2007.
“There has been a steep decline in top-line margins over the past 10 years, with return on assets declining across many regions and types of players,” says the report. Fortunately, bottom-line margins have not decreased as much as revenues, indicating that the firms have been managing costs to help mitigate negative trends.
“Cost, relative to assets under management, declined from 52 basis points in 2007 to 49 basis points in 2016. Overall, pre-tax profit margins dropped to 0.224% in 2016 from 0.33% in 2007,” says the report.
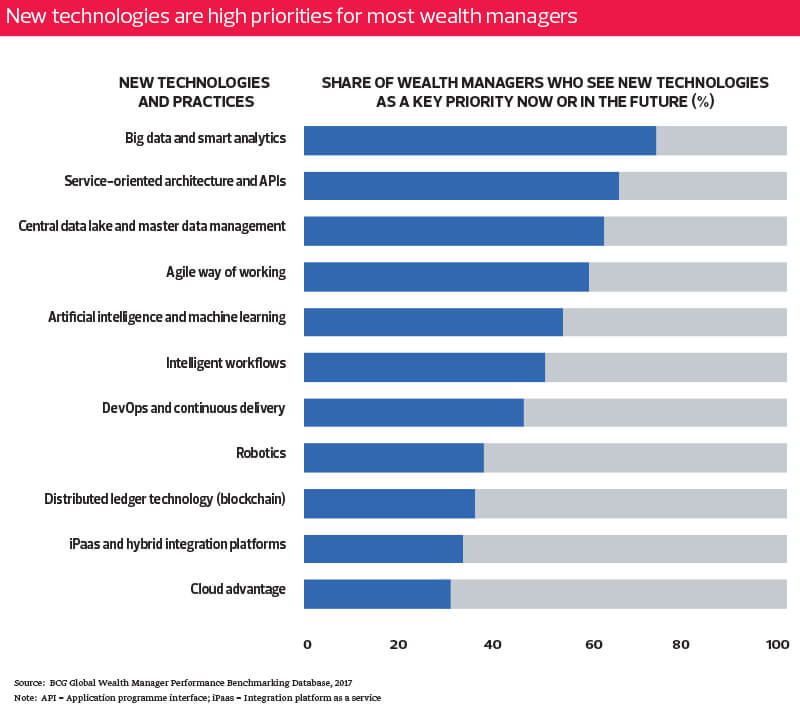
Digitalisation is the way forward, notes the report. For now, most wealth management firms have only embarked on basic digitalisation, which does not help them save enough cost or add more value for their clients.
“Most wealth managers have so far pursued digital innovation primarily as a feature selection exercise, centring on what their existing technology can provide, along with what competitors and fintech firms may intend to offer. Many of their digitalisation launches have been realised opportunistically, stemming from one-off task forces, thus producing basic, largely disconnected or insufficiently embedded digital capabilities,” says the report.
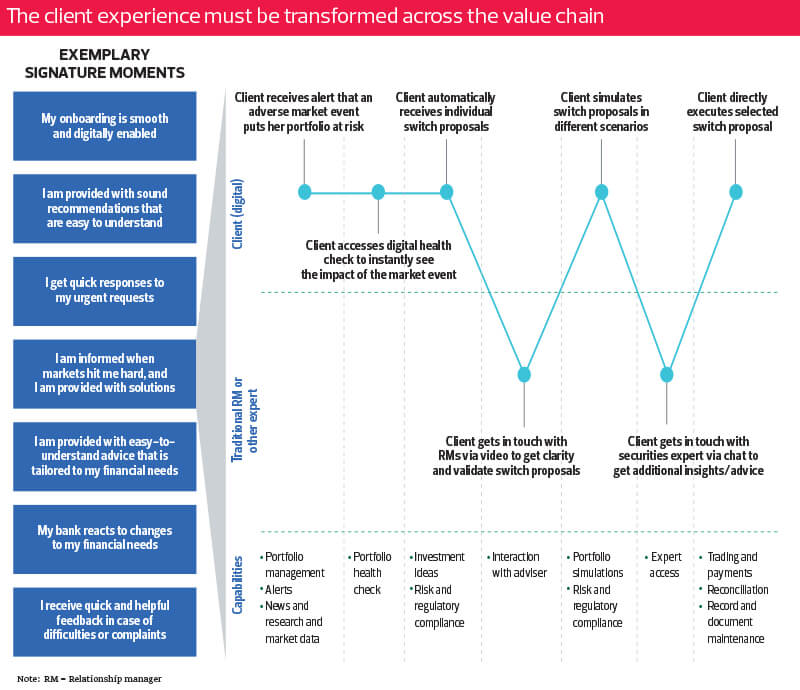
“According to our benchmark analysis, digital initiatives in the industry have centred largely on providing customers with basic portfolio functionalities and the ability to execute standard trading and payment transactions. What is needed, however, is to design and implement fully rethought, reworked and advanced client journeys across the entire value chain to transform the client experience.”
What the report proposes is a seamless experience it terms the “Client Journey 2.0”. It essentially means that the clients of wealth management firms could be instantly alerted to key market events, conduct a digital health check on their portfolios and automatically receive proposals to tweak their portfolios accordingly. In addition, clients could get in touch with their relationship managers to clarify and validate these proposals digitally and get in touch with securities experts to execute their trades.
The report says wealth management firms could have a revenue gain of 20% to 25% and an efficiency gain of 30% to 40% if the entire wealth management process is digitalised. It adds that many wealth managers have recognised the potential of this, but most of them are still way behind in terms of implementing it.
“Many wealth managers recognise that the potential benefits are substantial and they are exploring appropriate initiatives … Nonetheless, we have observed that most of them currently do not prioritise or design front to back [office] consistently — a signal that there is considerable progress to be made. The goals are achievable, but reaching them will require true commitment and perseverance,” says the report.
The report states that it is timely for wealth management firms to look into and embark on digitalisation now. “The time has never been more opportune to pursue a transformational approach to Client Journey 2.0 to connect the dots, apply new technologies and make a steep change in the client experience.
“Smart information gathering, pattern recognition, early process triage and automation through robotics — combined with artificial intelligence or machine learning — are sufficiently advanced to allow focused implementation. They can also provide tangible results, including improvements in both quality and the bottom line, within 6 to 12 months.
“Moreover, once launched, intelligence processing technology improves itself over time, integrating systematic learning from past decisions and from the continuous refinement of the algorithm. The complexity in client interactions, approvals, portfolio composition and execution can thus be scaled and enhanced.”
Global private wealth trends
Despite the falling revenues and profits of wealth management firms, global private financial wealth grew 5.3% to US$166.5 trillion last year, according to Boston Consulting Group’s Global Wealth Report 2017. It had increased 4.4% to US$158.2 trillion in 2015.
Last year’s growth was led by Asia-Pacific (9.5%), followed by Latin America (8.7%), the Middle East and Africa (8.5%), Eastern Europe (4.7%), North America (4.5%), Western Europe (3.2%) and Japan (1.1%).
Global private financial wealth is forecast to increase 6% annually until 2021, according to the report. This will be led by Asia-Pacific (9.9%), the Middle East and Africa (8.1%), Latin America (6.7%) and North America (5.6%).
Equities were the most favoured asset class globally last year. According to the report, 43% of global private wealth was invested in equities, 39% in cash and deposits and 17% in bonds.
In North America, however, 70% of private wealth was invested in equities, 16% in bonds and 14% in cash and deposits. In Western Europe, 39% was invested in equities, 25% in bonds and 37% in cash and deposits.
In Asia-Pacific, cash and deposits were preferred to stocks and bonds. Some 65% of private wealth in the region was held in cash while 23% was invested in equities and 12% in bonds. “The allocation to bonds grew slightly more than the allocation to cash and deposits in 2015, but bonds still had the lowest share of asset allocation,” says the report.
In terms of wealth expansion by segment, the upper high-net-worth (HNW) band posted the highest growth last year — 8% globally and in most regions. “An exception was Western Europe, where the lower HNW segment showed the strongest rise (7%). Moreover, the number of millionaire households (those who hold more than US$1 million in private wealth) increased at a higher rate than in 2015, driven by the strong growth of equities. Their share of overall wealth continued to grow in 2016 — a trend that shows no signs of stopping,” says the report.
Save by subscribing to us for your print and/or digital copy.
P/S: The Edge is also available on Apple's AppStore and Androids' Google Play.