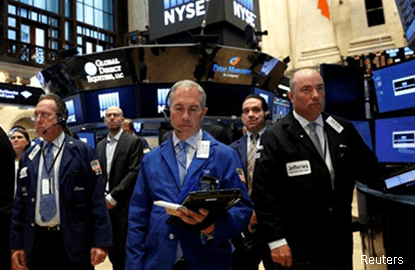
(Feb 24): Consecutive gains in the Dow Jones Industrial Average have left it at the doorstep of history, including a 20% surge in futures from the early hours of Nov 9 that could be loosely framed as the president’s own bull market. The 120-year-old measure has set a record on 10 straight days — the longest streak since the Ronald Reagan administration. Two more would tie it for the longest ever.
How does the future look when stock prices jump this fast? There’s good and bad news. The last time it happened, in January 1987, the Dow dropped 11% over the next year as the market endured one of its worst crashes. The previous occurrence in March 1964 saw the index climb 9.3% over 12 months.
The Dow’s continuing streak of all-time highs is the longest since it closed at a record 12 straight times in 1987. If the run got to 13, that would be the longest ever, according to Bloomberg data dating back to 1952. Records aside, the Dow’s streak of daily gains is also the longest in almost four years and would tie for the longest in 25 years with a jump on Friday.
To be sure, the contour of the rally has evolved since its first weeks, and not in an altogether good way. Energy stocks, one of the leading groups of the post-election surge, have faltered, down 2.5% this month. Small-cap shares thought to benefit most from Trump’s domestic growth agenda have also slowed, adding just 2.4% in February after surging 16% in the month following the vote.
Investors are putting more money into equities. Traders have poured US$45 billion into American stock ETFs and mutual funds in four months after yanking money in seven of the past nine years, data compiled by Investment Company Institute and Bloomberg show.